


With always-on tracing, you can now debug your real user requests without reproducing them.
Always-on tracing continuously collects traces from your production and preview traffic. Unlike session tracing, which only captures requests from your own browser, it samples your live traffic.
You control what's collected with sampling rules. Each rule sets a trace rate for an environment (All, Production, or Preview), optionally scoped to a path prefix like /checkout. Nothing is collected until you add a rule, so you pay only for what you choose to trace.
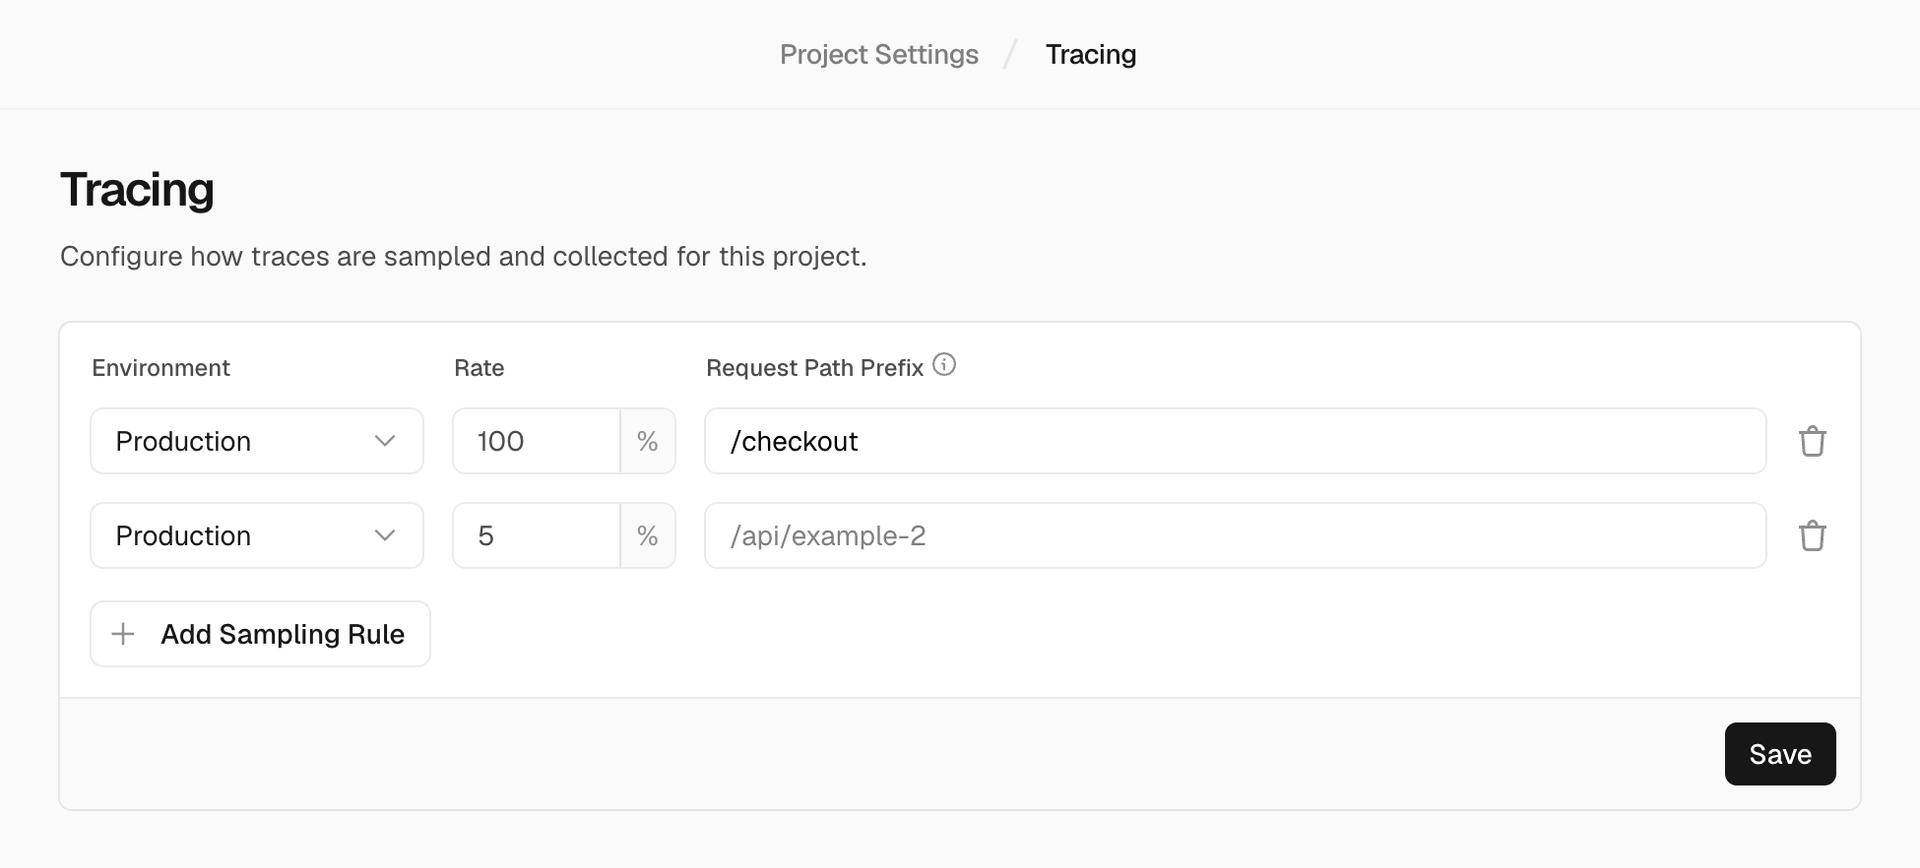
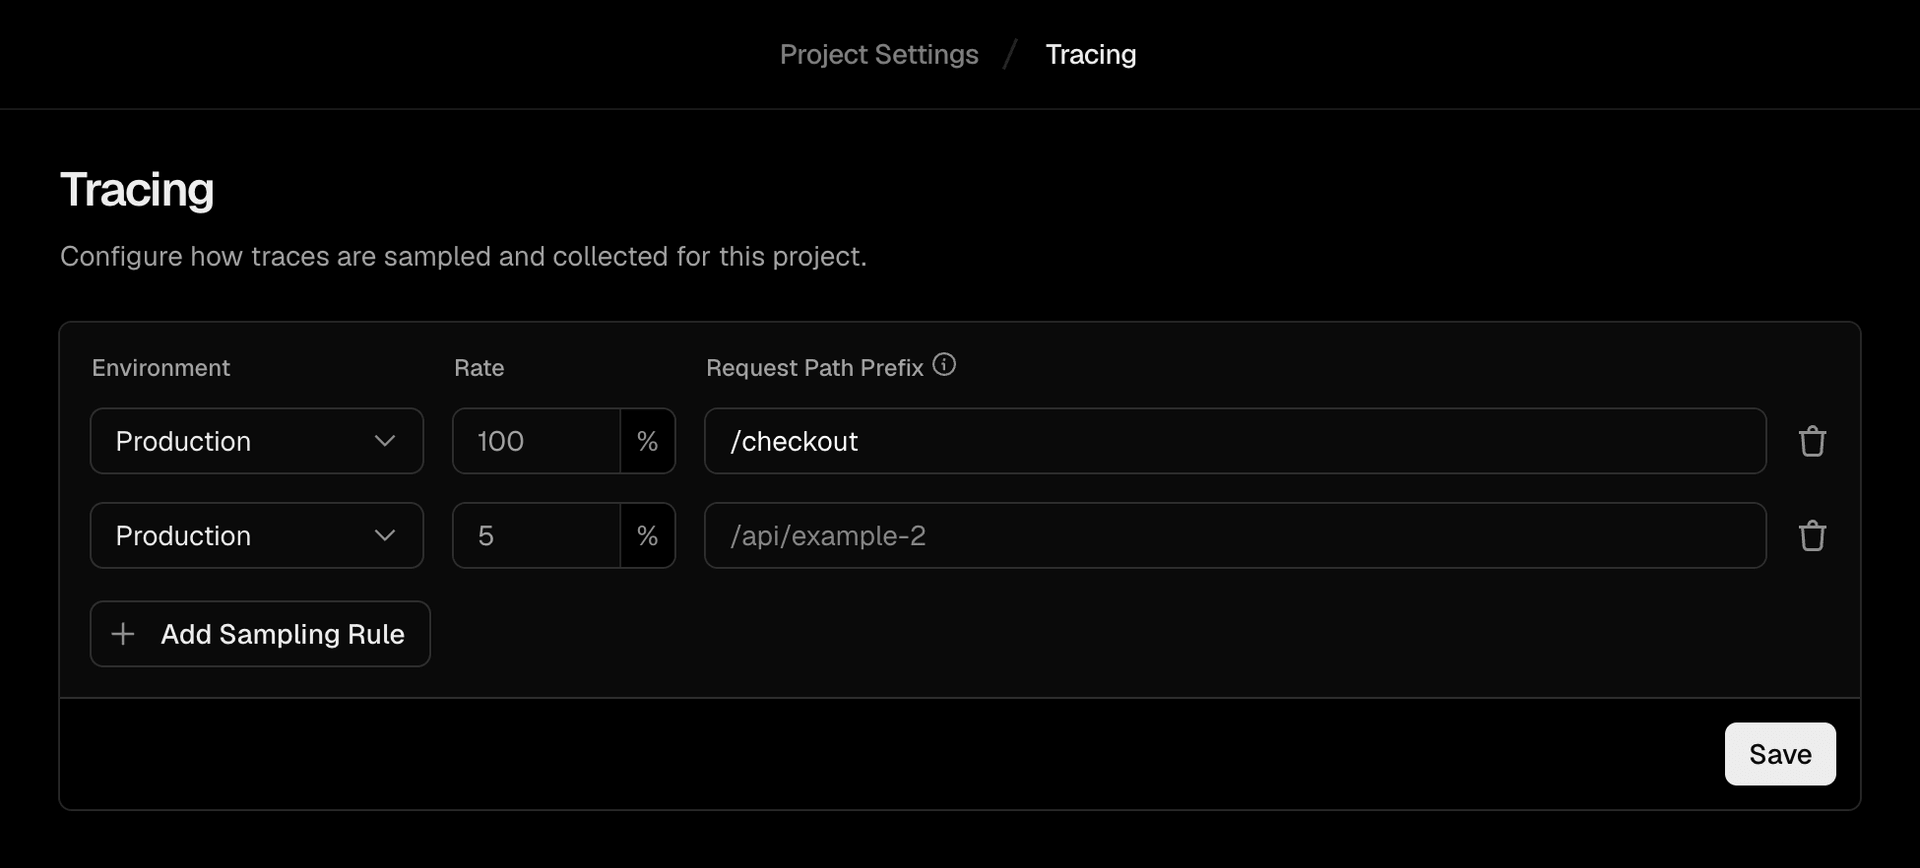
You can also manage sampling rules from the CLI. vercel traces config set adds a rule, or changes the rate of an existing one when you run it again with the same environment and path prefix:
# Trace a quarter of production trafficvercel traces config set production 25
# Trace every preview request to one path prefixvercel traces config set preview 100 /api
# Trace 1% of traffic in every environmentvercel traces config set any 1Infrastructure and outbound fetch spans are captured automatically. To add framework and custom spans, instrument your app with @vercel/otel.
To view a trace, open the Logs or run vercel traces get <request-id>.
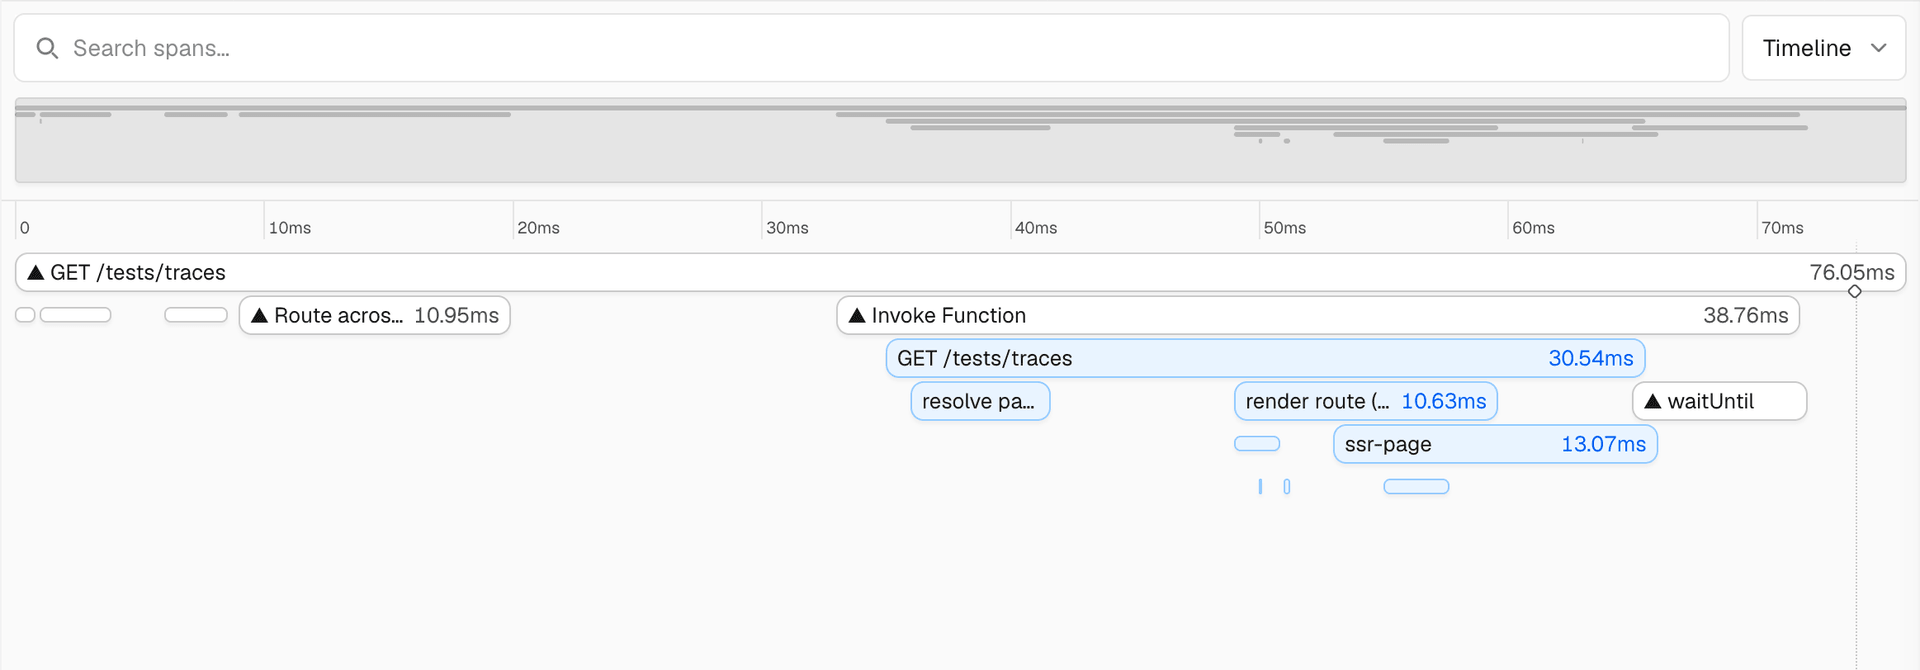
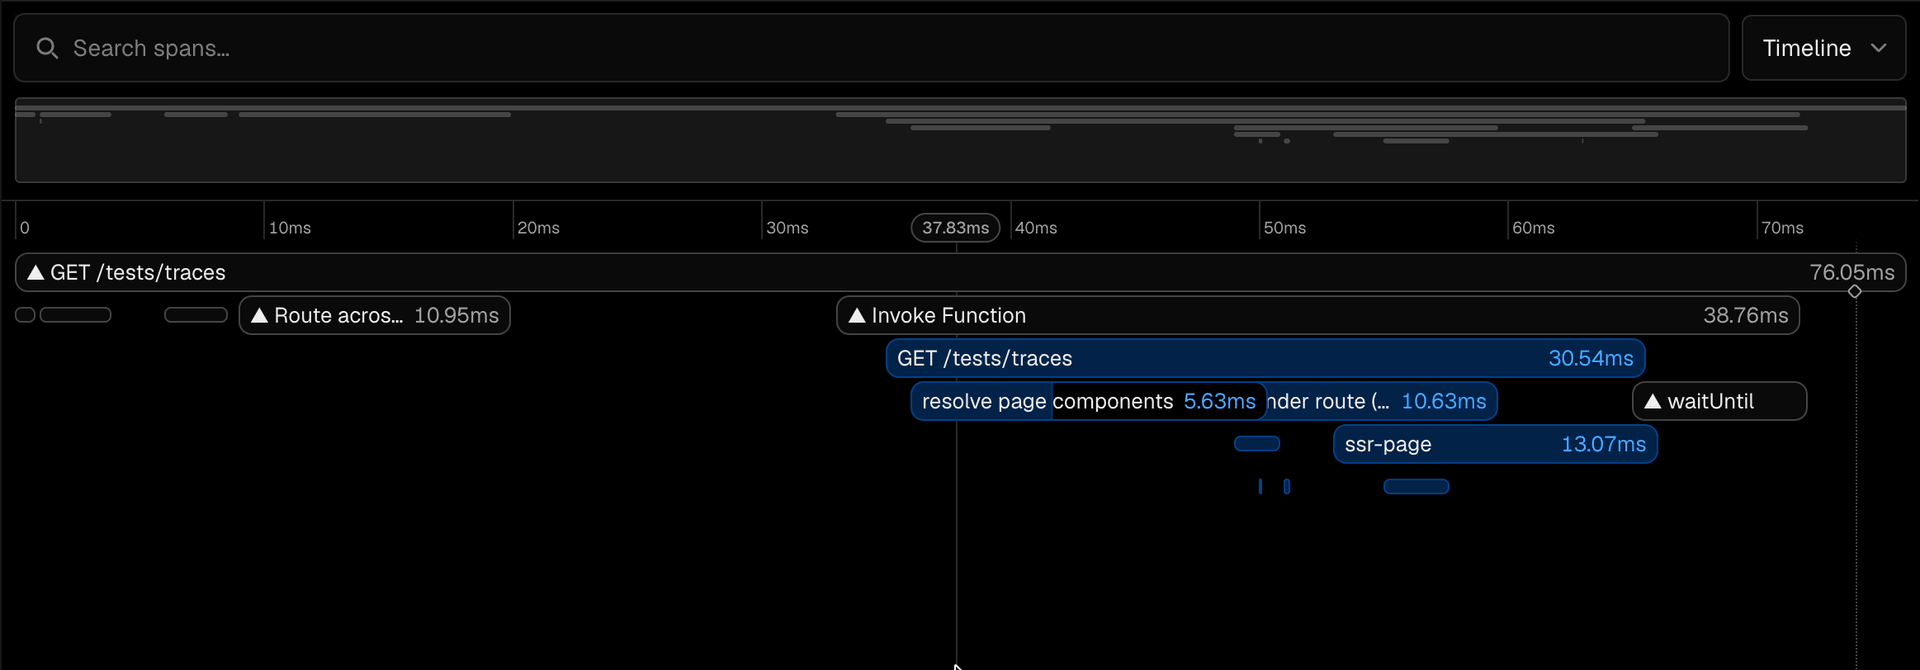
Always-on tracing is is now in beta and available to teams on all plans. Tracing is priced at $0.50 per 1M span units. Traces follow your runtime log retention: 1 hour on Hobby, 1 day on Pro and 3 days on Enterprise.
Get started by adding a rule in Settings → Tracing or from the settings icon in Logs. Learn more in the documentation.
